A Simple Guide to the DxOMark Numbers
Page 1 of 1. Version 2.3, ©2015 by Dale Cotton, all rights reserved.
Intro

If you're into photography and are researching the purchase of a new camera, the DxOMark web site is a gold mine. (DxO presumably stands for Digital x Optical.) This tutorial will walk you through getting up to speed on understanding and using the DxOMark sensor comparison tool without seriously straining any grey matter. Read slowly, ignore the pesky tech notes, and follow along with the step-by-step instructions.
DxO Labs is a French company that primarily produces a raw file conversion application called DxO Optics Pro. The systematic measurements they need to produce in order to incorporate each new camera model into their product produce a wealth of technical data. At some point they decided to turn this data into an on-line, public-service camera comparison tool called DxOMark.
The DxOMark camera test numbers have no brand bias, since DxO Labs necessarily has no ties to any one manufacturer. And DxO Labs' numbers have to be accurate in order for their raw converter to function properly and thus to compete with other raw converters. However, DxO Labs' numbers do have some limitations:
1. The methodology DxO Labs uses to capture its measurements involves working with the raw image file output of a camera. Not all cameras offer a raw file output option. Many of the less expensive cameras only offer JPEG output and so are omitted from the DxO database.
2. Another at least theoretical limitation is that a lens has to be used in order to take the pictures DxO Labs analyzes. Some cameras have a single lens permanently attached, but other cameras allow the use of a variety of lenses. In this later case there is some room for variation due to the inherent limits of even the best lens available for a given camera. So it's true that DxOMark's results are not pure sensor-system-only numbers But since cameras can't be used without lenses, this is not a practical concern..
3. Seemingly bizarrely, DxOMark does not test for sensor resolution, yet this is the first property of a camera's output that most people consider. In one sense, there is no need for a resolution measure, since the number is right on the spec sheet. A 16 megapixel camera has a resolution of 16 megapixels, which is 33% more than the resolution of a 12 megapixel camera, and 50% less than that of a 24 megapixel camera. Technically, this is naive. But since few photographers make use of more than a fraction of the megapixels a typical modern camera delivers, this is not often an issue.
Tech note: Problems testing sensor resolution. It's fine to say a sensor has X megapixels. But does a given camera actually deliver on the promise implied by that megapixel count? The answer to that is so complex that all one can say is: it depends on which lens is in front of the camera and at what aperture and focal length the lens+camera is tested for. Another issue is the degradation in resolution that happens right at the sensor (anti-aliasing filter, de-mosaicing).
Nevertheless, if a camera has a good lens attached, and that lens is used within its best range of aperture and focal length, slight usage issues such as shutter vibration are likely to overwhelm these comparatively minor factors.
Tech note: DxOMark lens testing. Actually, DxOMark does provide resolution test results, but it does so under its lens comparison tool – not as a part of the sensor comparison tool. You can access the lens test results for each camera you select in the sensor comparison tool. Just be aware that the results require very careful interpretation. (For one thing, the resolution numbers average the resolution at the centre of the lens together with the resolution at the corners. For another, the resolutions at all apertures are averaged together.)
The DxOMark overall summary number for a given lens+camera combo is just as problematic as the overall sensor score. So it's just as important to ignore those one-number scores and dig into the measurement graphs when looking at DxOMark's lens tests as it is for the sensor tests.
Using the Tool
Go to the DxOMark sensor compare page (Camera compare). Initially, you'll see this:
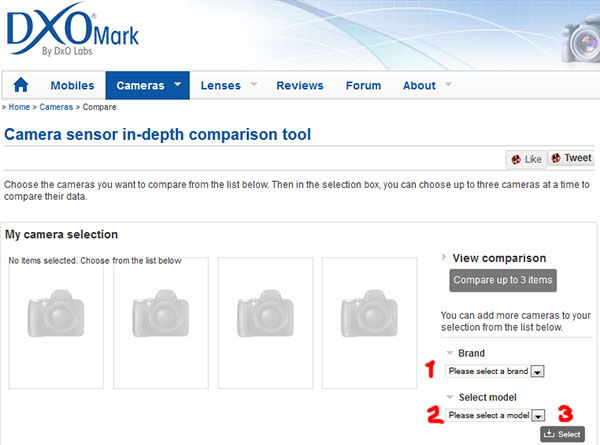
Fig. 1: Sensor compare
Click on the dropdown button indicated by the red numeral 1 in Fig. 1 to select a camera manufacturer, then select a model made by that manufacturer from the dropdown below. Finally, click on the grey Select button at the bottom. Repeat this for as many cameras as you wish to compare. To follow along with this tutorial, you may want to stop now to load in the same three cameras I've selected, as shown in Fig. 2:
Note: due to a site re-design you now have to click on the View comparison selection link to see anything like the following screen capture.
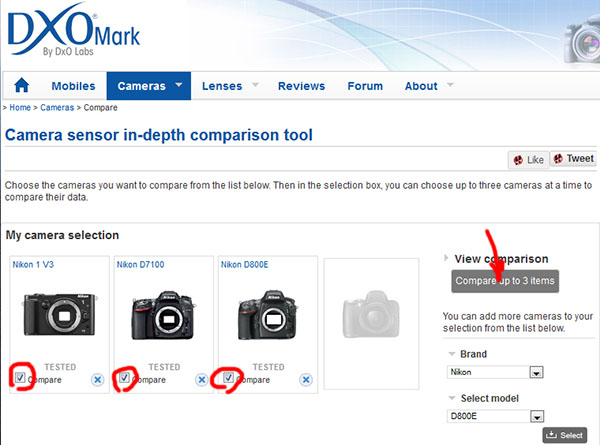
Fig. 2: Three cameras marked for comparison
(all from the same manufacturer to avoid brand wars)
The sensor compare tool only allows you to view the test results for up to three cameras at one time. So if you have more than three cameras in your pallet, simply check any three that you want to compare together. Note that a few cameras will have the word Preview under their picture instead of the word Tested. Preview cameras have not been tested, so typically there is no point in checking a Preview camera for comparison. Once you've checked up to three cameras, click on the grey button labelled Compare up to 3 items.
Tech note: Perpetual Preview. Most cameras are marked Preview because they're newly released. A few cameras will remain in Preview limbo for significant lengths of time because DxO Labs is trying to resolve some difficulty that camera poses in testing. Beyond that, most cameras by Fuji and Sigma use a non-standard sensor technology that is incompatible with DxO Labs analysis tools and may well never be tested.
Once the web site returns the results you requested, below the area in which you made your camera selections you'll see a results summary:
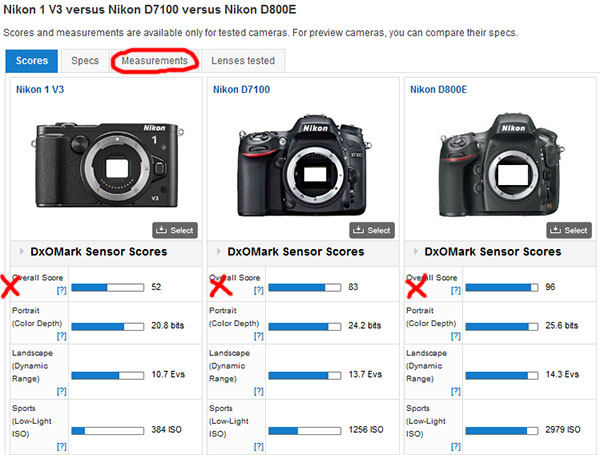
Fig. 3: Score summary
The first thing to do is to ignore that first line – Overall Score – for each camera. This is a purely arbitrary weighting of factors on DxO's part. It's there for people who simply have to have a bottom-line answer, no matter how meaningless it may actually be. The next three rows labelled Color Depth, Dynamic Range, and Low-Light/ISO also give single numbers for each camera. The first two are best-case measures and so are of only limited usefulness, unless you plan to always shoot in bright light and ideal conditions.
What you really want to do is ignore this entire summary and click on the tab labelled Measurements. Once the web page finishes loading, you'll see a graph labelled ISO Sensitivity. DxO Labs wants you to know to what degree they disagree with the camera manufacturer on how accurate their ISO settings are. For example, if you set camera X to ISO 400, DxO Labs may well feel what you're getting is actually ISO 302. This is interesting, but not typically a burning issue (unless perhaps you need to get identical results from different cameras on the same shoot).
So instead, click on the SNR 18% link:
Individual measurements 1: SNR
Primary relevance: shooting in low light without flash.
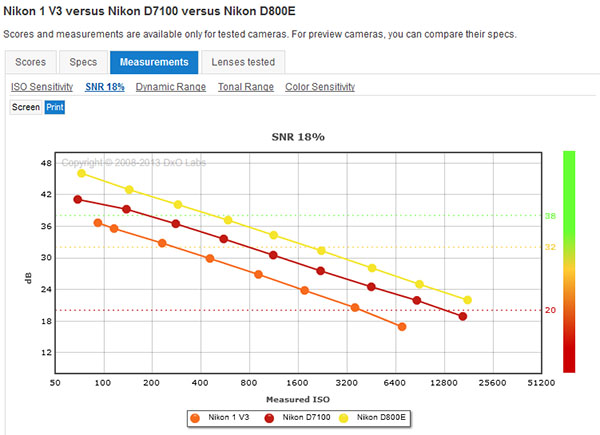
Fig. 4: SNR graph
SNR stands for signal-to-noise ratio. Noise is a strange term to use in the context of picture analysis. We have to understand that in this context noise simply means false information. If a 12 megapixel camera captures an image in which 3 million randomly scattered pixels contain false values, then the signal-to-noise ratio is 9/3, or 75% accuracy. With each step up in ISO there will be more noise and less signal for any camera. The lines on the DxO graph simply show the exact numbers.
Tech note: Why 18%? A picture can contain areas that are anywhere from pure white to pure black in brightness. But the average scene brightness is 18% of the maximum brightness or pure white. (It only takes 18% of the amount of light at full brightness to reach what we experience as half brightness.) Instead of posting separate graphs at many different light levels, DxOMark reports only the results at this average light level, which is representative of the other levels.
.Tech note: More on noise. False pixel values, or noise, arise from two main sources. Firstly, there simply are not enough photons (light particles) arriving from a typical scene to reach every pixel in the sensor. Your brain has sophisticated circuitry to literally fill in the blanks. Digital cameras are only in their infancy at doing this. Secondly, digital sensors are electronic devices. They generate a certain amount of electricity from various aspects of their functioning that bleeds into the image-forming signal. Both these sources of false data are typically amplified by the signal-boosting process we call increasing the ISO.
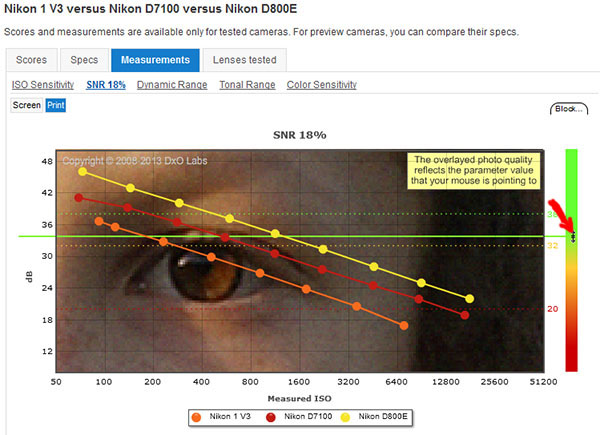
Fig. 5: Same as Fig. 4 but with pictorial overlay
Notice the red-orange-yellow-green bar on the right edge of each graph. Hover your mouse pointer over that bar to cause an illustrative picture to appear as background. As you move your mouse up or down the bar, the picture changes to show the better or worse quality at each level. A green line extends from your mouse pointer across the graph so you can see where the data line for each camera intersects with the quality level and ISO you're indicating.
To interpret the chart, use the legend below it to determine which line color represents which camera. In general, the higher the line, the more signal and less noise. The vertical scale is the SNR number. The horizontal scale is the ISO number. The actual values (in decibels, or dB) are not important in themselves. What we're looking for is the separation between the lines. In our example comparison we see a clear improvement as we go from the smallest sensor camera – the Nikon 1 V3 – to the largest sensor camera, the Nikon D800E. If any of the lines overlapped or had very little separation we could consider them as having equivalent ISO performance. (This is not to say that every bigger sensor outperforms every smaller sensor, but in this case it happens to be true.)
Tech note: Specs. How do I know whether a given camera has a larger or smaller sensor? Between the Scores tab and the Measurements tab is the very useful Specs tab. The 7th row shows Sensor size in millimetres. For the Nikon 1 V3 that's 8.8 x 13.2; for the D7100 it's 15.6 x 23.5, and for the D800E it's 24.0 x 35.9.
To get a better feel for the relative performance of the compared cameras, you can also move your mouse pointer over any dot on a line. This will pop-up the exact readings at the ISO setting at that point. By moving from left to right from a given ISO point you can see what the corresponding ISO is for each camera. So, if we follow the 36 dB line we cross the V3 at just above 200 ISO. Moving right we get to the D7100 at just under 400 ISO. Finally, we get to the D800E approximately half way between 800 and 1600 ISO. So we can read this to mean that we can get the same noise level from the D800E at maybe 1000 ISO as we do from the D7100 at 400 ISO and as we do from the V3 at 200 ISO. In photographic terms that means that the D7100 is roughly a stop better in performance than the V3, and the D800E is more than two stops better than the V3 (at the same aperture and shutter speed combination).
Tech note: an SNR work-around. It's easy to infer from the above that if you buy a Nikon V3 instead of a D7100, then you're stuck with a stop more noise in you pictures at any given ISO. First: in good light you're unlikely to see this difference, except possibly in extreme shadow areas. Second: you can get the same noise level from the V3 at any given shutter speed simply by using a one-stop wider aperture or one-stop slower shutter speed. If the scene requires a 1/30 second exposure at f/8 at 1600 ISO on the D7100, you can shoot at 1/30 and f/5.6 at 800 ISO on the V3, which will give you the same noise you would have got with the D7100. This works because the depth of field is roughly the same in both cases at a given focal length.
This "trick" breaks down when you're trying for less, not more, depth of field, or when you run into the maximum aperture of the lens.
Individual measurements 2: Dynamic Range
Primary relevance: shooting in high contrast lighting situations.
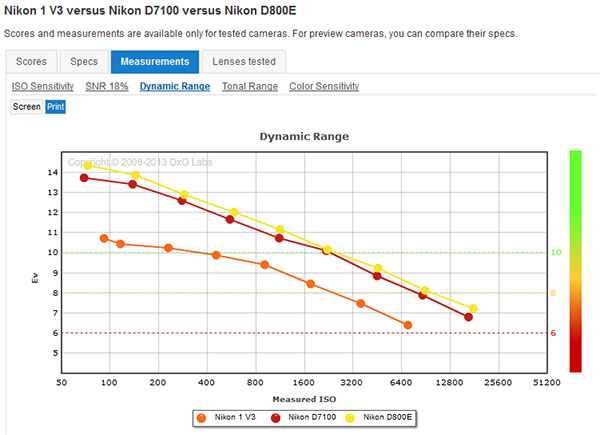
Fig. 6: Dynamic range graph
Dynamic range is how great an extreme from the darkest part of a scene to the brightest that a camera can capture. If the range is too great, the camera will either show the brightest areas as pure white or the darkest areas as pure black, or both at once. Most cameras can capture the dynamic range of most scenes with no problem so long as the proper exposure is chosen. But situations that challenge a camera are not that uncommon. One great example is an interior room with a window looking outside during daylight. Our eyes typically have no problem showing us both the interior and exterior parts of the scene, but rarely can a camera come even close to doing the same.
Looking at Fig. 6 we can see right away that the D7100 and D800E are quite close in dynamic range performance, but the V3 lags very far behind. While the gap closes as we go up in ISO numbers, even at 800 ISO on the V3 we see the other two cameras weighing in at 3200 ISO. This means the V3 is two stops worse than the D7100 and D800E at that ISO.
Tech note: Engineering DR. If the dynamic range numbers look suspiciously large to you, that's probably because they are. When reporting dynamic range for film, there are some well-agreed-upon and realistic measures. But for digital the only non-subjective measure, called engineering dynamic range, provides numbers that are typically two or three stops larger than what we'd expect based on film test results or even from our own experience.
The difference comes in the dark end of the range. For engineering dynamic range a dark area is considered acceptable so long as at least 50% of its pixels are non-noise. In practice, that means that not only would you not be able to distinguish a black cat lurking in a dark shadow – you'd have a great deal of trouble identifying even a white cat.
Individual measurements 3: Tonal range
Primary relevance: converting your pictures to black-and-white.
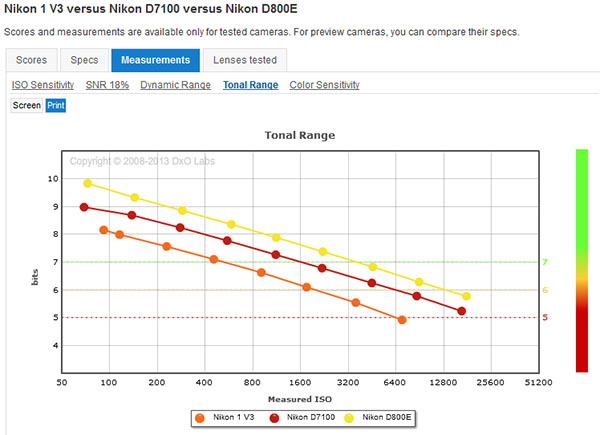
Fig. 7: Tonal range
Clicking on the Tonal range link brings up a graph that is primarily of use when converting a camera's output from colour to black-and-white. The higher the value at any point the more shades of grey the camera can capture at that ISO. More shades of grey mean a smoother transition from darker to lighter. These numbers are actually given in bits instead of shades of grey. This tells us how many bits of data the camera needs to record in order to store all the grey scale information it can capture.
Individual measurements 4: Color sensitivity
Primary relevance: making high quality prints of your colour photographs.
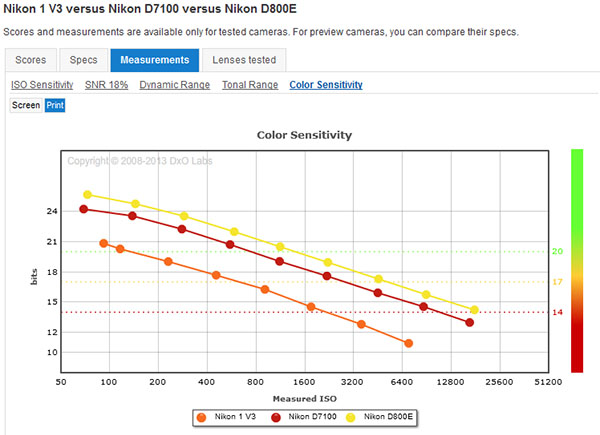
Fig. 8: Color sensitivity
The Color sensitivity graph is parallel to the tonal range graph but reports instead how many distinct colour hues a camera can capture at each ISO setting. If a picture shows a red coffee mug lit on one side, there will be a gradation from the well-lit portion to the full-shadow portion of the mug. Our eyes will show a perfectly smooth transition. The higher the numbers in this graph, the smoother the transition will be in a photograph.
Tech note: Screen|Print. Just below the graph type links (such as SNR and Dynamic range) on the far left you'll see buttons to toggle from Screen to Print numbers. Sometimes all that happens is that the graph lines move up and down in tandem. But sometimes they don't.
What's happening is that the Screen graph shows the actual test numbers, while the Print version shows the numbers chopped down to an 8 megapixel lowest common denominator. So, if camera A has more noise than camera B, but camera A also has more megapixels of resolution, each of its pixels, whether noise or signal, will occupy a smaller portion of a sufficiently small print. Thus, camera A's noise level may actually be less visible in the printed output than camera B's noise.
The problem with this approach is that photographers often buy cameras with more megapixels precisely in order to make larger prints.
Upshot: Despite the Print graphs being the default. The Screen graphs are the actual measurements. The Print graphs are only relevant to the degree that you routinely down-sample high resolution images to low resolution.
Rolling Your Own
If we only paid attention to DxO's arbitrary Overall Score, we'd be missing nearly all the information that we can learn from this tool. Even the sub scores only give a very biased story. Yes: the dynamic range of the V3 is very inferior to the other two cameras, but we now know that the gap does narrow significantly as we go to higher ISO settings.
The reason the DxO overall scores are meaningless is that they presume your use of a camera is the same as some mythical Average Photographer. If you never work in low light situations without a flash or studio lighting, then the ISO/low-light numbers are of little value to you. Similarly, if you only work with studio lighting, you're much less troubled by a low dynamic range value. Finally, as mentioned in the Intro, The DxO scoring doesn't even include resolution.
If you're shopping for a camera, what you want to do is systematically narrow down your list of potential purchases. There are many factors you'll need to weigh. Image quality is one of them. You may find it helpful to roll your own sensor or image quality score for a given camera, based upon your own take on the noise levels, dynamic range, etc. you saw in the Measurements graphs.
To do this you need to understand your own needs. If you rarely shoot without flash or other added lighting, that tells you that DxOMark's ISO numbers are of little interest to you. If you rarely encounter a problem with blown highlights or inky shadows, that tells you that your dynamic range needs are modest. If you only display your pictures on-line or via other monitor, both the tonal and colour range numbers are irrelevant to you.
But what about resolution? Again, if you only display your images via a computer or television screen, you'd need to buy an expensive 4K display to make use of even 8 megapixels. Any more than that is only useful when you want to crop away part of an image to concentrate on a central region. Assuming that instead you do print, then you need to estimate your maximum resolution needs for printing. Anything in excess of your personal needs may actually be useless or even detrimental, since larger image files consume storage space.
Let's consider an example scenario. You enjoy an active night life, which includes the bar scene, dinner parties, etc. You love to take pictures in those situations but want to get away from the intrusiveness of flash. So DxOMark's SNR/ISO numbers are critical to your choice of a camera. When you do shoot in daylight, you can't recall ever having an issue with white skies or black shadows. So DxOMark's dynamic range numbers are of little interest. Finally, the few occasions you've made a print in the past several years have been small 4x6 inch or at most 8x10 inch glossies using your budget home inkjet. That pretty much eliminates any concern about the tonal and colour range numbers. It also says you'll be happy with anything over 8 megapixels, which includes just about anything made at present.
So in this scenario, a camera with an exceptional ISO graph will get your 10 rating for image quality so long as it has even the most mediocre numbers in the other areas. Similarly, a camera with a poor ISO graph has to get your 1 through 5 rating, no matter how awesome its other graphs look. It's totally irrelevant what overall score DxOMark assigned a given camera. All that matters is where it falls on your own 1 through 10 rating system for image quality. You can eliminate a whole lot of potential camera purchases in short order in this way.
Non-tech note: a handy companion to DxOMark when researching cameras is camerasize.com. This gives you a feel for how big the cameras you're investigating are, especially as compared to each other.