The RX100/2 Meets SAM
And you go to boot camp
Table of contents. Page 4 of 4. Version 1.1, ©2013 by Dale Cotton, all rights reserved.
Appendix A: Aperture, Shutter, and ISO Concepts
There are three factors that together determine exposure: aperture, shutter speed, and light sensitivity (AKA ISO).
Aperture Basics
Instead, of always making maximum use of the full diameter of the lens, strangely, we very often cut the diameter down, which deliberately reduces the amount of light that gets used to take a picture. Why do this?
- Occasionally, we do this simply because the scene is so bright that even at the maximum 1/2000th shutter speed we can't keep from over-exposing the scene.
- More frequently we'll do this because we know that when the lens is wide open the edges of the frame will be just a little less sharp than otherwise (because light is bent more at the edge of the lens than the center).
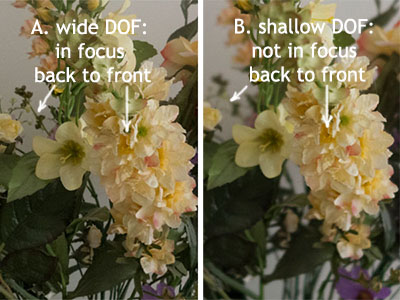
Fig. A-1: Deep depth of field vs. shallow depth of field
- But most often we'll reduce the size of the lens opening because doing so increases what's called the depth of field, or DOF. Up to a certain point the smaller the lens opening the more of a scene from close to the camera to far away from it will be in focus.
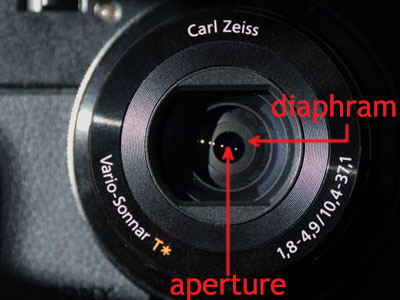
Fig. A-2: Aperture and diaphragm at f/4
The size of the lens opening is called the aperture. The expanding and contracting barrier that blocks light from passing except through the aperture is called the diaphragm and works much like the iris of an eye. The ratio of the lens opening size to full open is called the f/stop ratio. We'll talk a bit about actual numbers below.
Shutter Speed Basics
I'll explain this for completeness, but I'm sure you already know this one. There is a barrier called the shutter between the front of the lens and the sensor inside the camera. This opens when you press the shutter release button to take a picture, then closes after a pre-set length of time (except in bulb mode, which requires you to press the shutter release a second time).
- The shorter the open-shutter interval, the less blur from motion in front of the camera and from the camera itself.
- But conversely, the shorter the open-shutter interval, the less total light reaches the sensor, running the risk of under-exposure.
Sensitivity/ISO Basics
Both the label sensitivity and the label ISO are misleading. What this should be called is signal amplification, signal boost, or gain. It's exactly the same mechanism as turning up the volume on an audio device or the brightness on a video device. It's also much the same thing as watering your wine.
Example: Let's say you're a spy, detective, or just plain nosy. You have something called a directional microphone and a headset. There are people talking a hundred feet away that you want to listen in on. You can't even hear a whisper from them at that distance, but by pointing the mike in their direction, then turning up the volume, you can make out what they're saying. However: their words are almost drowned out in a sea of wind noise, traffic noise, static hiss and crackle. The more you turn up the volume/gain, the worse the ratio of signal (what you want to hear) to noise (everything else) becomes.
- Every camera has what's called its base ISO, which is normally between 100 and 200 on the relevant ISO scale. For the RX100 base ISO is 125 and for the RX100M2 it's 160.
- As you change the ISO setting to a larger number, you're artificially allowing the camera to use less light to take a picture. But you pay two prices for this magic. You're introducing more "noise" – meaning pixels with nonsense colour values that are randomly strewn throughout the picture. You're also clipping off the top of the range from darkest to lightest from the values in the scene that the camera can record. This is known as reducing dynamic range (explained below).
- As you change the ISO setting to a number smaller than base ISO, you're also clipping the range of scene brightnesses the camera can record.
Tying it all together
For convenience sake we work with each of these three variables – aperture, shutter speed, and ISO – in a system of "stops".
Why "stops"?: This peculiar use of a familiar word goes back to the early days of photography when photographers used a set of thin black panels with various sized circular holes drilled in them to act as the apertures in their cameras. The panels stopped all but a specific fraction of the light that would otherwise reach the photosensitive emulsion on a glass plate at the back of the camera.
Every one-stop change in aperture OR shutter speed has the effect of halving or doubling the amount of light that reaches the sensor. If you make a one-stop change to increase the aperture diameter, you've doubled the amount of light. If you make a one-stop change to decrease the aperture diameter, you've halved the amount of light. Ditto with shutter speed. Equally, a one-stop change in ISO doubles or halves the exposure result of whatever amount of light is reaching the sensor.
More on doubling and halving: However, your brain does not respond to a doubling or halving of a given amount of light in a literal fashion. It takes three stops of light change for us to experience a scene as being twice or half as bright. The RX100/2 lets us select 1/3 stop values for shutter speed and aperture (but not ISO). Given our insensitivity to brightness changes, changing shutter or aperture by 1/3 only has a 1/9th effect on our perception. Time has shown that to be all the fineness of control that's needed.
Another term that's frequently used in photography is dynamic range. This is simply a) the number of stops of brightness from the darkest element to the brightest element of a scene; or b) the number of stops from darkest to lightest that a given camera can capture at a given ISO setting.
The above is a whirlwind summary of basic concepts. We go into more depth, including example images, in the body of the tutorial.
Appendix B: Reading a Histogram
If you're not seeing the histogram in the bottom right corner of the LCD, press the DISP button until you do. Move the camera about, pointing at brighter and darker places. As you do, notice how the white stuff inside the histogram box keeps morphing its shape. This is a bar graph that is changing in real time. The up/down axis of the bar graph is number of pixels. The left/right axis is brightness from black on the left end to white on the right end.
No actual numbers are shown in the bar graph. It's not there to report numerical values. Instead, the shape of the histogram simply reflects how much of the scene is relatively dark and how much is relatively bright. But your eye already tells you that just by looking at the scene. The crucial thing the histogram does is show you whether parts of the scene are too bright for the camera to record at the current exposure settings, or too dark.
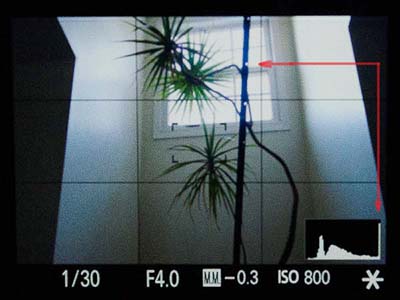
Fig. B-1: Histogram, spike on right
In Fig. B-1 the bulk of the white area inside the histogram is in two humps to left of centre. This is the bottom half of the picture plus the two nearly black wedges on right and left. The white on the right half of the histogram corresponds to the window and the bright parts of the wall beside the window. If there is a white line climbing upward on the far right edge of the histogram box as we see in Fig. B-1, the length of that line tells you how much of your picture will be exposed as pure white – which usually means blown highlights. In this case, the white spike on the right are the all the pixels from the sky as seen through the window. Similarly, if there is a white line climbing upward on the far left edge of the histogram box, the length of that line tells you how much of your picture will be exposed as pure black. This is a bit of a judgment call, since there could well be parts of the scene that should be pure black, but at least you know it's happening.
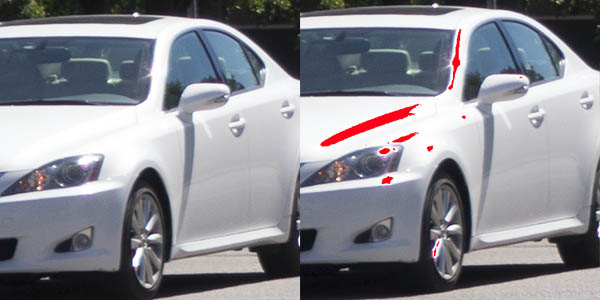
Fig. B-2: Specular glare indicated in red on right
In Fig. B-1 the spike on the right warns us that the sky shown through the window will be pure white, not blue or grey. But in Fig. B-2 the right spike is showing us what is called specular glare, usually sunlight or lamp light reflected off a mirror-like surface (speculum being the Latin word for mirror). Specular glare will be pure white no matter what exposure you choose, so you simply let it happen. But also, the car in Fig. B-2 is painted pure white. It's a judgment call whether you want any portion of a pure white object, such as a house painted white or bright clouds, to spike on the histogram.
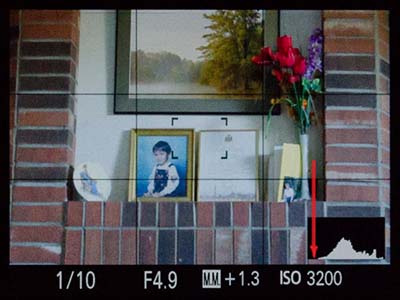
Fig. B-3: No pixels on left
Another concern is whether there are any pixels at all at the left edge. Pictures with no pure black in them tend to look hazy. If you're shooting in fog, that's exactly what you want. If you're deliberately shooting what's called a high key shot, fine. But most of the time you want the left edge of the bar graph to snug up to the left edge of the histogram box, but without piling up there too heavily.
What about ETTR?: You may have heard Expose To The Right or ETTR. This only applies if you are deliberately shooting with the intent of optimizing the image in post-processing. Otherwise, about all ETTR means is to use the lowest ISO number possible, while still keeping your shutter speed and aperture within the range you think is acceptable.
In case you're interested in learning more: Understanding Histograms on Luminous Landscape.